绝美学术论文配图之基于R语言(ggstatsplot)包
忙里偷闲,在网上看到一绝美论文配图,制图优美,配色赏心悦目;是由作者IndrajeetPatil集合开发的ggstatsplot包,其实说白了,就是ggplot2的升级版,该升级版将箱线图与小提琴图进行了整合,话不多说,直接上操作!
组间的均数比较(ggbetweenstats函数)
#作物表型记录本
#加载包
library(ggstatsplot)
library(ggplot2)
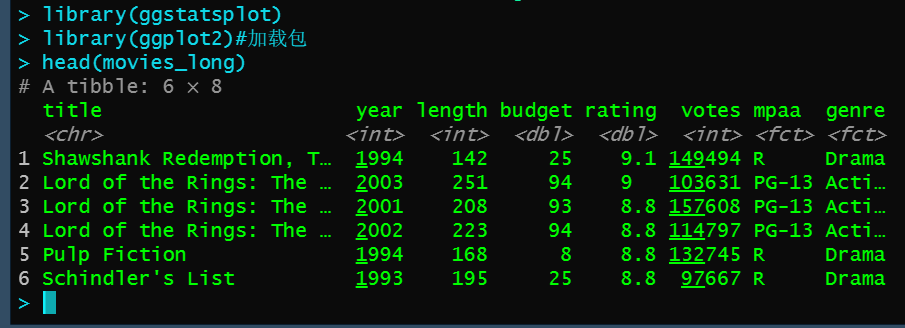
#读取包自带数据,默认前6行
head(movies_long)
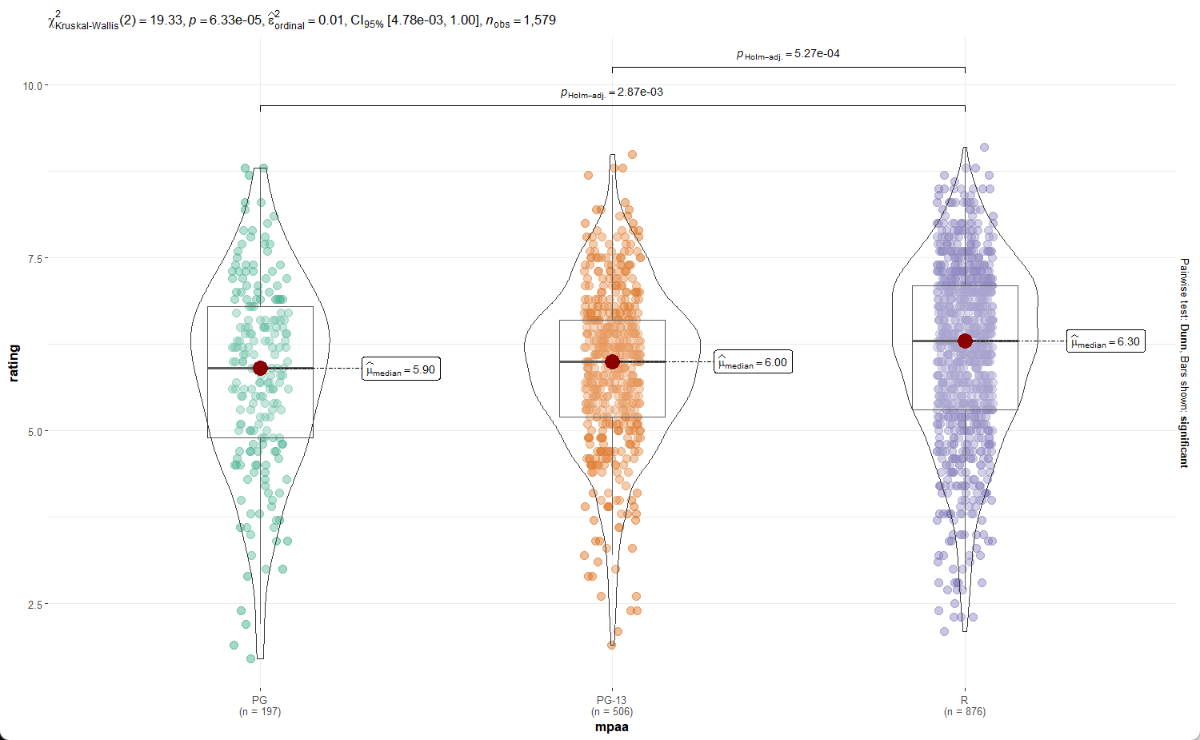
#使用ggbetweenstats函数进行参数设置并绘图
ggbetweenstats(
data = movies_long,
x = mpaa, # 设置横坐标分组,分组需≥2
y = rating,# 设置纵坐标分组,需数值型变量
)
图片上部分的一行代表(Frequentist)的一些统计值,下面部分代表Bayesian统计值,且在这其中,下方的Bayesian可以去掉,只要设置默认情况下参数
type = "p"为type = "np"即可。
#加载包

library(ggstatsplot)
library(ggplot2)
#读取包自带数据,默认前6行
head(movies_long)
#使用ggbetweenstats函数进行参数设置并绘图

ggbetweenstats(
  data = movies_long,
  x = mpaa, # 设置横坐标分组,分组需≥2
  y = rating,# 设置纵坐标分组,需数值型变量
  type = "np", #期望的统计类型(“参数”或“非参数”或“稳健”或“贝叶斯”)。也接受相应的缩写:“p”(参数)、“np”(非参数)、“r”(稳健)或“bf”resp。
  messages = TURE# 逻辑上决定是否显示贝叶斯因子对零假设的偏好。此参数仅与参数测试相关(默认值:TRUE)
)
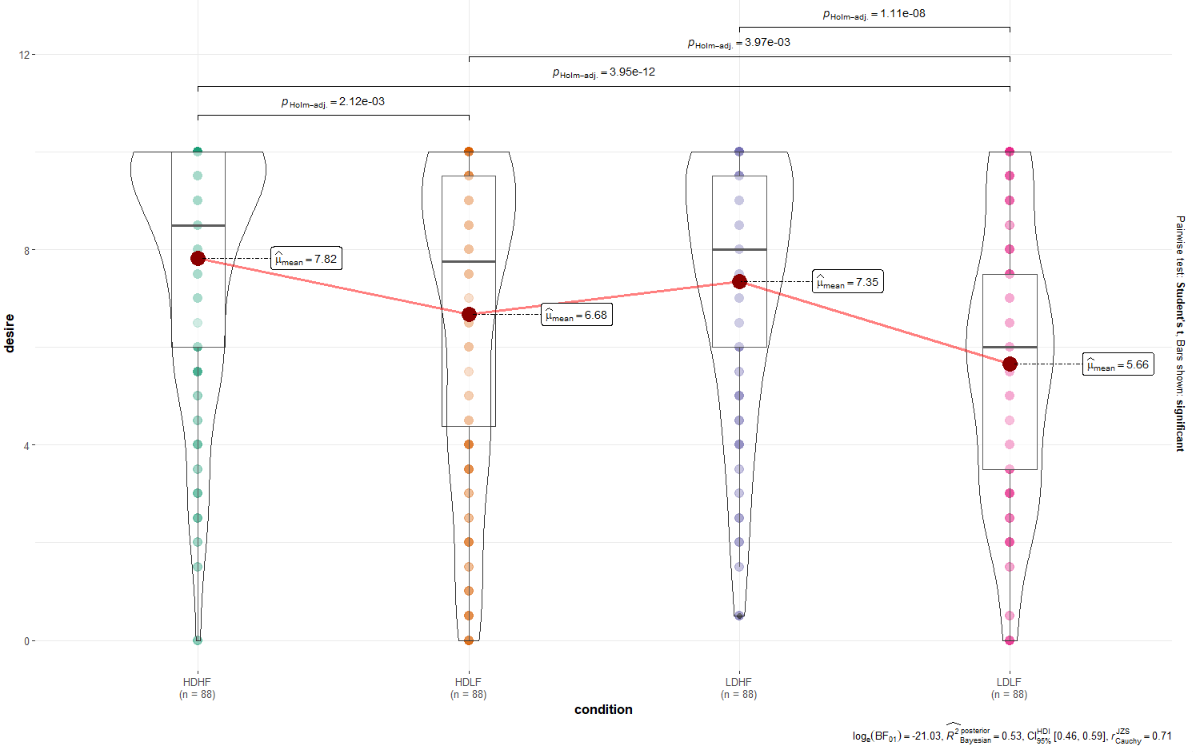
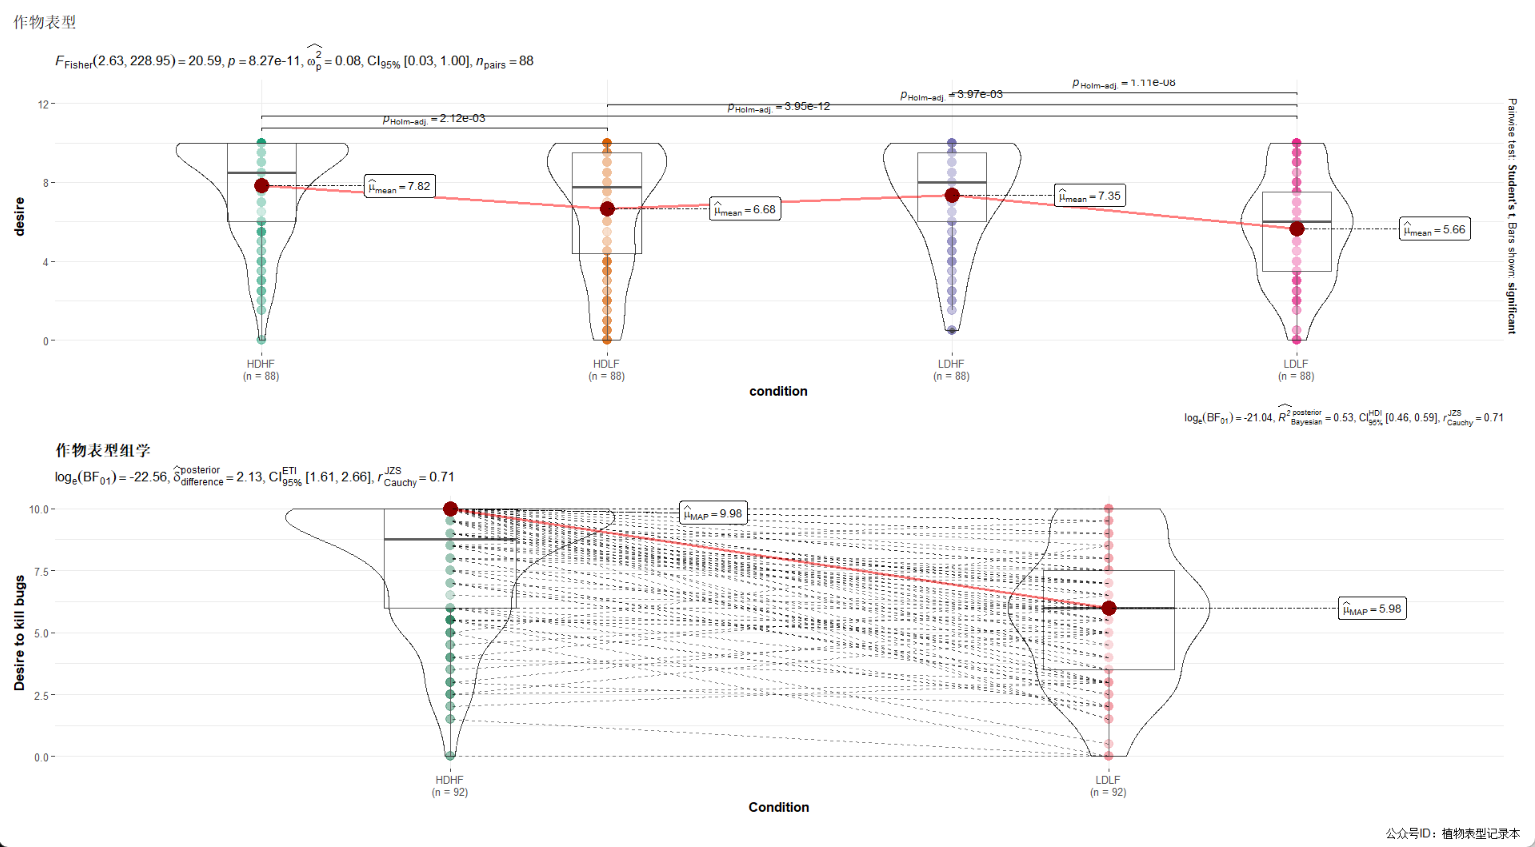
组间的比较(ggwithinstats函数)
ggwithinstats用于绘制组内比较的小提琴箱线组合图,此函数为ggbetweenstats的孪生函数,行为方式也基本相同。绘图结构之间区别在于在组与组均值之间通过路径连接来突出数据间彼此配对。 还以包里自带数据进行演示,最简单的调用方式:
#以bugs_long数据集中任意两列分别作为纵横坐标进行分析
aa <- ggwithinstats(data = bugs_long,x=condition,y=desire)
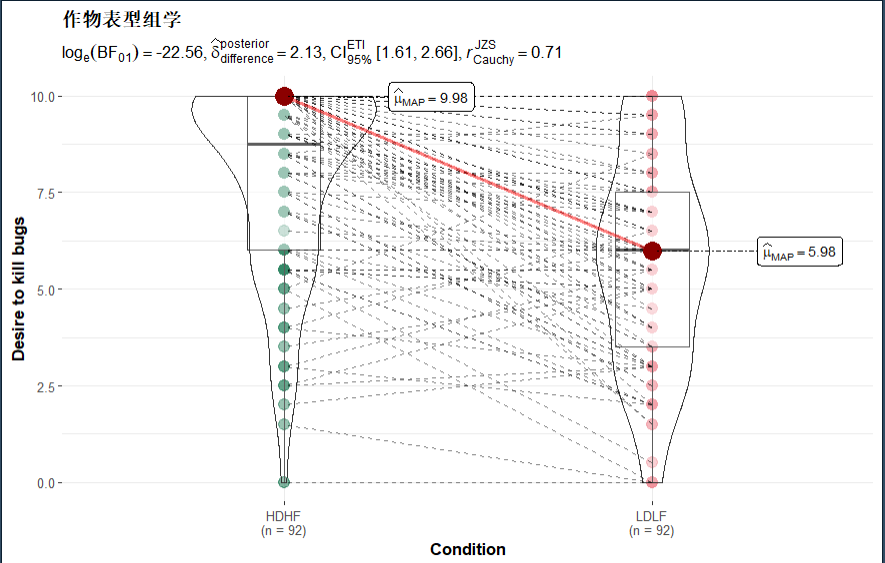
参数检验
#数据清洗,进行参数检验
qw1 <- dplyr::filter(bugs_long, condition %in% c("HDHF", "LDLF"))
ggwithinstats(
  data = qw1,
  x = condition,
  y = desire,
  xlab = "Condition",
  ylab = "Desire to kill bugs",
  type = "bayes",
  outlier.tagging = TRUE ,##显示离群值
  title = "作物表型组学",
  pairwise.display = "significant",
  package= "yarrr",
  palette= "info2")
将以上两张图结合
qw1 <- dplyr::filter(bugs_long, condition %in% c("HDHF", "LDLF"))
ab <- ggwithinstats(
  data = qw1,
  x = condition,
  y = desire,
  xlab = "Condition",
  ylab = "Desire to kill bugs",
  type = "bayes",
  outlier.tagging = TRUE ,##显示离群值
  title = "作物表型组学",
  pairwise.display = "significant",
  package= "yarrr",
  palette= "info2"
)
aa <- ggwithinstats(data = bugs_long,x=condition,y=desire)
combine_plots(
  plotlist = list(aa,ab),
  plotgrid.args = list(nrow = 2),
  annotation.args = list(
    title = "作物表型 ",
    caption = "公众号ID:植物表型记录本"
  )
)
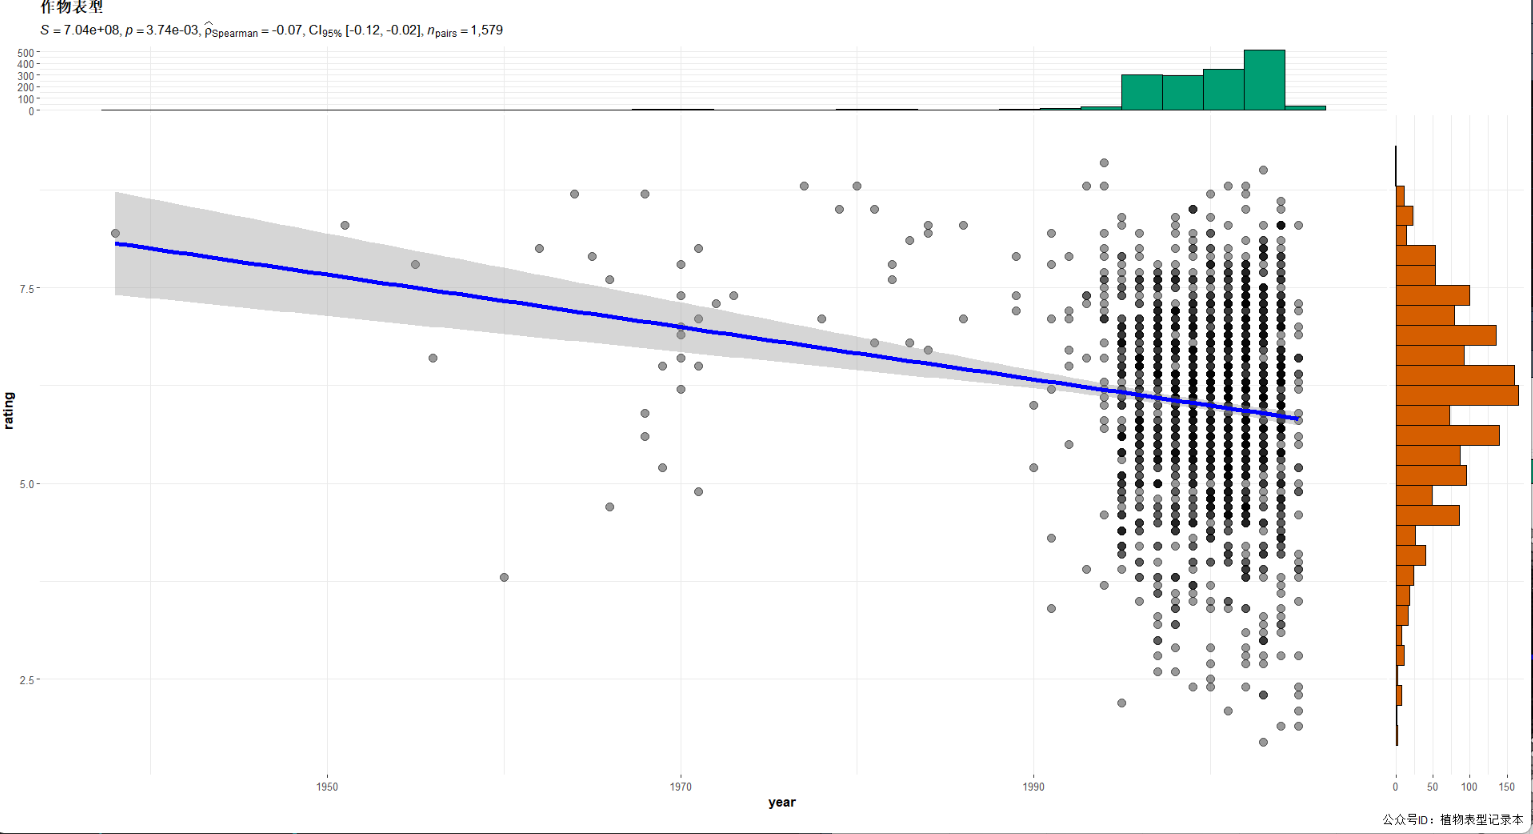
散点图(ggscatterstats()函数)
library(ggside)
bb <- ggscatterstats(movies_long,
                     x=year,
                     y=rating,
                     bf.message = F,
                     type = "np",
                     title = "作物表型 ",
                     caption = "公众号ID:植物表型记录本",
                     package= "yarrr",
                     palette= "info2")
本文由 mdnice 多平台发布